目录
1 对陀螺仪的噪声分析:艾伦方差(Allan Variance)
艾伦方差原本是用来衡量晶振的频率稳定性的,但也可以用来衡量内参噪声。
这个方法很简单,可以鉴别和量化惯导传感器的不同噪声项。
通过艾伦方差的方法可以得出的噪声项有5个,分别是:
- 量化噪声(quantization noise)
- 角度随机游走(angle random walk)
- 偏置稳定性(bias instability)
- 速率随机游走(rate random walk)
- 速率斜坡(rate ramp)
对时域信号Ω(t)的Allen方差分析包括:
- 计算Allen方差根/Allan偏差
- 将计算出来的值作为不同时间t的函数
- 分析对数-对数图中Allan偏差曲线的特征区域和尺度斜率,识别不同的噪声
2 针对陀螺仪数据绘制一张Allan偏差图以识别噪声
1.在陀螺仪静止时,获取陀螺仪的输出 \(\Omega(t)\) , 采样数是 \(N\) , 采样周期是 \(\tau_{0}\) 。
2.令平均时间为 \(\tau=m \tau_{0}\) , \(m\) 可以任意选择,但是需要满足 \(m<(N-1) / 2\) 。
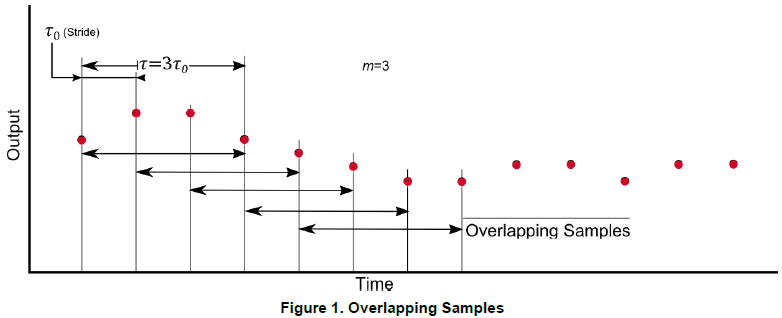
3.将信号时间序列分成多个时间片,每个时间片长度满足
\(\tau=m \tau_{0}\)
,相邻两个时间片之间的区别就只在于其中一个周期
\(\tau_{0}\)
的时间不同,如下图所示:

4.分片之后,可以有两种方式计算Allan方差:
1)计算每个分片内采样数据的的平均值,在2.2节中提到;
2)对应于每种陀螺仪采样速率,输出角度θ,在2.1节中提到;
5.最后对一个特定的𝜏值计算Allan偏差值,然后对不同的𝜏值计算Allan方差,就能得到Alla偏差图,见2.3节。
2.1 通过输出角度计算Allan方差
对应于陀螺仪采样,可以计算出每个时刻的积分值(也就是角度),然后计算Allan方差。
1.计算每次角速率采样时累积的θ值,通过下面的公式计算:
\(\theta(t)=\int^{t} \Omega\left(t^{\prime}\right) d t^{\prime} \tag{1}\)
例如:
\(\begin{align}
t_{k} & =\tau_{0},2\tau_{0},3\tau_{0}\left(k=1,2,3\right) \\
\Omega_{k}\left(t\right) & =10,12,15 \left(k=1,2,3\right) \\
\theta_{k}\left(t\right) & =10\tau_{0},22\tau_{0},37\tau_{0}\left(k=1,2,3\right) \\ \tag{example}
\end{align}\)
2.当N个θ值被计算出来之后,通过公式(2)计算Allan方差:
\(\begin{align}
\sigma^{2}(\tau) &=\frac{1}{2 \tau^{2}}<\left(\theta_{k+2 m}-2 \theta_{k+m}+\theta_{k}\right)^{2}> \tag{2} \\
\sigma^{2}(\tau) & =\frac{1}{2 \tau^{2}(N-2 m)} \sum_{k=1}^{N-2 m}\left(\theta_{\mathrm{K}+2 m}-2 \theta_{\mathrm{K}+m}+\theta_{\mathrm{K}}\right)^{2} \tag{3} \\
\end{align}\)
上面公式(3)是通过公式(2)化简得到的。
\(N\)
是总的采样次数;
\(\tau=m \tau_{0}\)
是分片时长;
\(K(1,2,...,N)\)
是一系列离散值。
2.2 通过输平均输出速率采样值计算Allan方差
我们也可以通过计算每个分片时间内角速度的平均值来计算Allan方差.
1.在
\(K \tau_{0}\)
和
\(K \tau_{0}+\tau\)
的时间范围内,平均值为:
\(\begin{align}
\overline{\Omega}_{\mathrm{K}}(\tau) & =\frac{1}{\tau} \int_{\mathrm{K} \tau_{0}}^{\mathrm{K} \tau_{0}+\tau} \Omega(t) dt \tag{4} \\
\overline{\Omega}_{\mathrm{K}}(\tau) & =\frac{\theta_{\mathrm{K}+m}-\theta_{\mathrm{K}}}{\tau} \tag{5} \\
\end{align}\)
公式(4)和公式(5)等价,都可以用来计算平均值。
例如:
\(\begin{align}
k &=2 \\
m &=3 \\
K\tau_{0}+\tau & =(K+m)\tau_{0} \\
\overline{\Omega}_{2}(\tau) & =\frac{\theta_{5}-\theta_{2}}{3 \tau_{0}} \tag{6} \\
\end{align}\)
当这样计算完
\(N-m\)
个值后,我们可以通过下面的公式计算Allan方差:
\(\begin{align}
\sigma^{2}(\tau) & =\frac{1}{2}<\left(\overline{\Omega}_{\mathrm{K}+m}(\tau)-\overline{\Omega}_{\mathrm{K}}(\tau)\right)^{2}> \tag{7} \\
\sigma^{2}(\tau) &=\frac{1}{2 m^{2}(N-2 m)} \sum_{j=1}^{N-2 m}\left\{\sum_{i=\mathrm{K}}^{j+m-1}\left(\overline{\Omega}_{\mathrm{K}+m}(\tau)-\overline{\Omega}_{\mathrm{K}}(\tau)\right)^{2}\right\} \tag{8} \\
\end{align}\)
公式(8)由公式(7)扩展得到。
2.3 计算Allan偏差并画出Allan偏差图
通过公式(3)或者公式(8)得到对Allan方差(Allan Variance)取平方根,得到的这个值叫做Allan偏差(Allan Deviation)。
这个Allan偏差是针对一个特定的
\(\tau\)
的。即:
\(A D(\tau)=\sqrt{A V A R(\tau)} \tag{9}\)
因为提到过 \(\tau\) 是可以任意取值的,例如可以取2的指数次,或者是某个对数次。Allan偏差通常是按照 \(\tau\) 的变化画在对数-对数图上的。
3 噪声识别
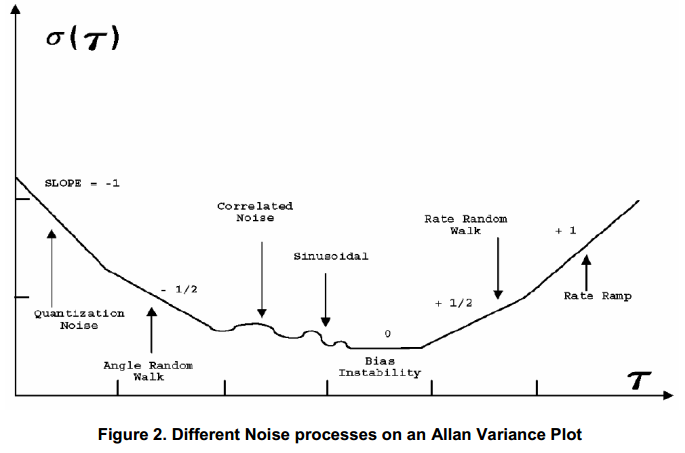
- 不同类型的随机过程导致具有不同的斜率出现在Allan偏差图上。
- 不同的过程通常出现在τ的不同区域,可以轻松识别它们的存在。
- 确定过程后,可以直接从图中读取其数值参数。
- 对于诸如陀螺仪之类的MEMS器件,要测量的重要过程是随机游走和偏置不稳定性(有时也称为偏置稳定性),可以通过以下方式识别和读取:
White Noise/Random Walk
白噪声/随机游走出现在Allan方差图斜率为-0.5的地方。
对角速度来说,得到的是ARW(Angle Random Walk);
对加速度来说,得到的是VRW(velocity Random Walk);
随机游走通过直线拟合图像,然后在
\(\tau=1\)
的地方读取数值。
ARW的单位是
\(dps/\sqrt{Hz}\)
。
Bias Instability
偏置不稳定性出想在曲线最小值最平稳的地方(斜率为0,且是极小值)。
它的数值等于Allan偏差曲线的最小值。
对于陀螺仪而言,偏差稳定性测量了在常温下,陀螺仪偏置的变化,这通常用
\(dps/sec 或者 dps/hr\)
作单位表示。
从下图中可以观察出不同的噪声过程:

计算Allan方差和Allan偏差的代码
function [T,sigma] = allan(omega,fs,pts)
[N,M] = size(omega); % figure out how big the output data set is
n = 2.^(0:floor(log2(N/2)))'; % determine largest bin size
maxN = n(end);
endLogInc = log10(maxN);
m = unique(ceil(logspace(0,endLogInc,pts)))'; % create log spaced vector average factor
t0 = 1/fs; % t0 = sample interval
T = m*t0; % T = length of time for each cluster
theta = cumsum(omega)/fs; % integration of samples over time to obtain output angle θ
sigma2 = zeros(length(T),M); % array of dimensions (cluster periods) X (#variables)
for i=1:length(m) % loop over the various cluster sizes
  for k=1:N-2*m(i) % implements the summation in the AV equation
    sigma2(i,:) = sigma2(i,:) + (theta(k+2*m(i),:) - 2*theta(k+m(i),:) + theta(k,:)).^2;
  end
end
sigma2 = sigma2./repmat((2*T.^2.*(N-2*m)),1,M);
sigma = sqrt(sigma2)
代码解释:
1)Omega is the gyro rate output. (Section 2, Step 1)
2)m is chosen arbitrarily and the
\(\tau\)
value is defined as m*sample period. (Section 2, Step 2)
3)In the code above, the methodology described in Section 2.1 is used to compute Allan variance.
4)Theta is obtained by the cumulative sum of the output rate data divided by the sampling frequency (exactly as explained in equation (1)). This Theta is the output angle obtained corresponding toeach sample. (Section 2.1, Step 1).
5)As m is available and so is the output angle corresponding to each output rate sample, equation(3) is directly implemented in the above code to compute Allan variance (sigma2 in the code)(Section 2.1, Step 2).
6)Allan deviation (sigma in the code) is then computed by taking the square root of AVAR, equation (9) (Section 2.3).
参考文献
[1] Freescale Semiconductor, Inc. Allan Variance: Noise Analysis for Gyroscopes, link.
[2] Miloš SOTÁK, František KMEC, Václav KRÁLÍK3, THE ALLAN VARIANCE METHOD FOR MEMS INERTIAL SENSORS PERFORMANCE CHARACTERIZATION, link.
[3] Leslie Barreda Pupo, Characterization of Errors and Noises in MEMS Inertial Sensors Using Allan Variance Method, link.
[4] Martin Vagner, MEMS GYROSCOPE PERFORMANCE COMPARISON USING ALLAN VARIANCE METHOD, link.